Track the Results#
AMAGO uses Weights and Biases to track experiments. Each run is tracked on a webpage we can view from any browser. Configure wandb experiment with:
experiment = Experiment(
    log_to_wandb=True,
    wandb_project="my_project_name",
    wandb_entity="my_wandb_username",
    ...,
)
Or set the environment variables AMAGO_WANDB_PROJECT and AMAGO_WANDB_ENTITY. Once training or evaluation begins, this run would appear at https://wandb.ai/my_wandb_username/my_project_name/ under the name my_run_name.
Interpreting the wandb Metrics#
Data is organized into sections. From top to bottom:
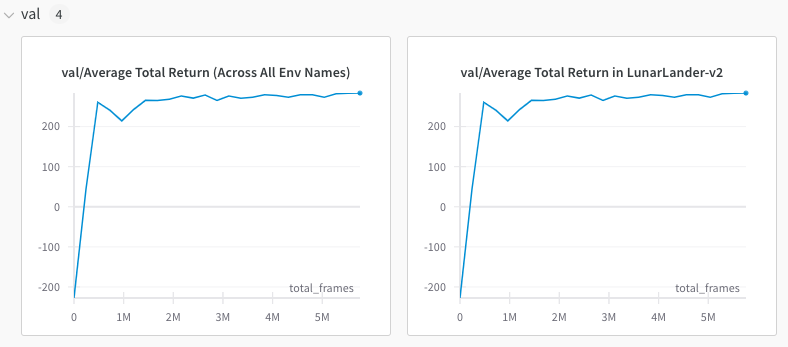
test/: If the run has finished and calledExperiment.evaluate_test, the test metrics would be here. Test metrics are usually the same asval/(see below).dataset/: Metrics provided by theRLDataset.Charts/: These are your x-axis options. More on this in a moment.train/: RL training metrics for debugging. Many of the metrics will be familiar but others are unique to AMAGO implementation details. You can probably ignore this section unless training is not going well and you want to dig into why that is. Most of this data is generated duringamago.agent.Agent.forward().val/: Contains the policy evaluation metrics."Average Total Return (Across All Env Names)"is the typical average return during eval rollouts. The return is also broken down by “environment name”. The environment name is set by theAMAGOEnv(see Setup the Environment) and is used to track results for each task in multi-task experiments. We also log the “Bottom Quintile” return by environment name. There might be many more metrics here depending on the environment/experiment. For example, some envs track a “success rate” and some meta-RL envs record stats by episode/attempt.
System/: These are hardware-related metrics that are logged automatically bywandb.
X-Axes
The default wandb x-axis (“Step”) isn’t very useful — it’s the number of times wandb.log has been called.
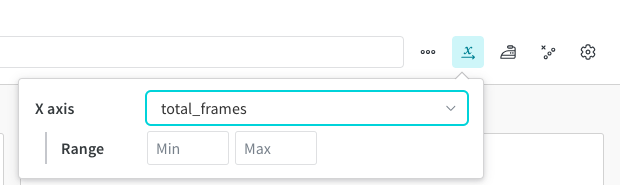
We can change the x-axis in the top right corner. "Wall Time" is available by default and we can plot any train/val metric by the names in the Charts/ section.
total_frames is the typical RL learning curve x-axis showing the total number of times we’ve called env.step to collect data.
In multi-task settings we will also find the total frames collected in each individual “environment name”.
You can also plot metrics by the training Epoch or gradient_steps.
Command and Configuration#
If we click on “Overview” (in the top left corner), we’ll find a record of the command that was used to launch the experiment. We’ll also find a “Config” section that lists all of the configuration settings for this run.
Examples#
Here is a link to a single-task gym run with the simplest eval metrics: Click Here
And here is a link to a Meta-World ML45 run, which is an extreme case that tracks 272 evaluation metrics across its 45 meta-training tasks: Click Here